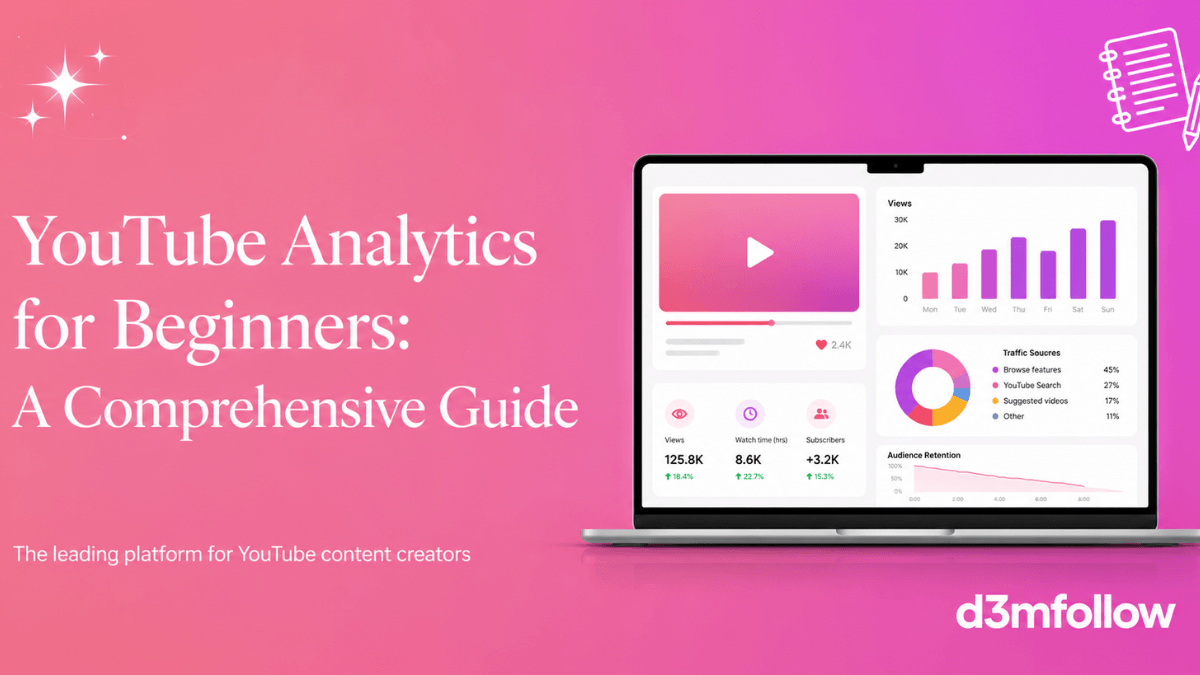
Disclosure: Declared by the seller before the reports: the YouTube views service linked below is D3M Follow's, and it corrupts the numbers this page teaches you to read rather than answering them. Purchased hours do not count as qualified watch hours.
Direct answer: YouTube Analytics is not a dashboard to watch daily, it is a tool that answers specific questions. Three numbers cover most decisions: click-through rate tells you whether the packaging works, average view duration tells you whether the video keeps its promise, and traffic sources tell you where people came from. Note one official distinction: from 24 August 2026 a public view is counted from the moment playback starts across all formats, while eligibility and earnings continue to be calculated on engaged views and qualified watch hours.
- Three numbers cover most decisions: CTR, average view duration, and traffic sources.
- From 24 August 2026 a public view counts from the start of playback in every format.
- Eligibility and earnings stay on the qualified and engaged metrics, not the displayed count.
- The retention curve explains causes; the number alone does not say where the problem is.
- Playlists raise session time, which the watch reports measure rather than the view counter.
How to open YouTube Analytics
On desktop, sign in to YouTube Studio and click Analytics in the left menu for channel-level reports. For a single video, open Content, hover over the video and choose Analytics. The YouTube Studio mobile app has the same reports. Some reports exist only at video level (the audience retention report is one), and some only at channel level (the Content tab), and the help pages say so explicitly.
If Studio itself is new to you (uploads, comments, customization), start with the YouTube Studio guide. This page is only about reading the numbers.
The seven tabs and the question each one answers
According to the "Get started with YouTube Analytics" help page (read 21 August 2026), each tab is built around a different question:
- Overview: a high-level summary of channel or video performance, including the Realtime and Typical performance reports.
- Content: how your content performs with your audience, split into videos, Shorts, live, posts, playlists and podcasts. Channel level only.
- Reach: how people found you: impressions, click-through rate and traffic sources.
- Engagement: how people interact once they arrive: watch time, average view duration, likes, end screen element click rate.
- Audience: who is watching: returning and new viewers, monthly audience, when your viewers are on YouTube, watch time from subscribers, device, age and gender.
- Revenue: shown only to channels in the YouTube Partner Program; it carries earnings plus RPM and CPM. Interpreting those metrics is not this page's job; the monetization pages on this site cover it.
- Trends: what your audiences are viewing, to find ideas and content gaps for the next video.
The Realtime report in Overview gives, in YouTube's words, early insight into recently published videos: your top videos and subscriber count, a comparison of the last 60 minutes against the last 48 hours, and a filter by format such as videos or Shorts. In practice it is a reassurance tool for the first day or two, not a decision tool. YouTube's own CTR page warns against judging click-through rate before a substantial number of impressions has built up.
Core metrics: definition, location, decision
The definitions below closely follow YouTube's help pages (read 21 August 2026). The "decision" column is our editorial reading.
| Metric | Official definition (short) | Where | Decision it supports |
|---|---|---|---|
| Views | The number of legitimate views on your content; from 24 August 2026 counted the moment playback starts, on all formats | Overview, Content | Raw reach; compare with pre-24-August numbers only with care |
| Watch time (hours) | The amount of time viewers have watched your video | Overview, Engagement | Which topics deserve longer videos or series; detail in the watch time and watch hours guide |
| Average view duration (AVD) | Average minutes watched among those who stayed to watch; calculated from engaged views and their watch time | Engagement, video level | Do people stay? Deep diagnosis lives in the audience retention guide |
| Impressions | How many times your thumbnails were shown to viewers on YouTube through registered impressions | Reach | Is YouTube showing your content at all? |
| Impressions click-through rate (CTR) | How often viewers watched a video after seeing a registered impression | Reach | Do title and thumbnail persuade? Explained on the CTR page |
| Traffic sources | How viewers found your content: YouTube search, browse features, suggested videos, external, channel pages, others | Reach, Content | Which distribution channel you really depend on, and which is fragile |
| New and returning viewers | Returning = already watched your channel and came back in the period; new = first time | Audience | Are you building an audience or renting one-off reach? |
| Monthly audience (new / casual / regular) | Unique viewers in the last 28 days, split by watch behaviour | Audience | The real size of your active audience and who deserves targeted content |
| Watch time from subscribers | Percentage of watch time from subscribers vs non-subscribers | Audience | Does a subscription mean actual watching on your channel? |
| End screen element click rate | How often viewers clicked each end screen element (video level only) | Engagement | Do your end screens move people to the next video? |
Views: what changes on 24 August 2026
The official "Understand your YouTube content performance" page (read 21 August 2026) states it plainly: beginning 24 August 2026, views are counted the moment a video starts to play across all formats, including Shorts, long-form videos and live streams. It adds that the update won't impact YouTube Partner Program earnings or eligibility: earnings will still be based on "engaged Shorts views" and "engaged watch hours", eligibility on "qualified Shorts views" and "qualified watch hours".
What that means for someone reading the reports: the public view counter will rise after that date without any change in how people actually watch. So when you compare a September upload with a July one, look at watch time and average view duration before view count. Note too that the "How engagement metrics are counted" page says YouTube checks that metrics come from actual humans and not computer programs, and may temporarily slow down, freeze or change a metric count. A frozen counter in the first hours is not necessarily a problem.
Watch time and qualified hours
Watch time is a metric and qualified watch hours are an eligibility condition, and the two do not match. This section explains the metric; the eligibility threshold belongs to the requirements page.
Watch time: the channel metric vs your personal "time watched"
The same phrase means two different things on YouTube. As a viewer, "time watched" is a personal counter in your account that tells you how long you spent on YouTube today or this week. As a creator, "watch time (hours)" is defined by YouTube's own Analytics pages as the amount of time viewers have watched your video, and it is reported per video and for the whole channel. This page is about the second meaning.
Two neighbouring metrics get confused with it. Average view duration is the average minutes watched among those who stayed to watch, calculated from engaged views (YouTube's definition), and average percentage viewed is the share of the video they got through. Watch time adds up every minute, so a short video with a very large audience can bank more hours than a long video almost nobody finishes. To read these numbers side by side in Studio, use the YouTube Analytics guide; to diagnose why people leave mid-video, use the audience retention guide.
Why watch hours go down
- The rolling window: the counted hours cover the last 12 months (365 days in the 2027 wording). A hit from 13 months ago left the count today. This surprises more creators than anything else on the list.
- Deleting a video or making it private: its hours are no longer public, so they leave the qualified counter.
- Pausing uploads: older videos gradually lose recommendation momentum, and new hours stop replacing the ones ageing out of the window.
- Removed views: YouTube says it may temporarily slow down, freeze or change a metric count and removes low-quality views. An unnatural spike followed by a drop usually means views that were not accepted.
- Seasonality: exam-season, Ramadan or event-driven topics rise and fall with their season, and YouTube's performance FAQ lists topic interest, competition and seasonality among the external factors behind traffic swings.
For the rest of the growth metrics and how to read them together, see the YouTube growth and analytics guide.
For anyone weighing the paid route: the YouTube views service on the YouTube views page is a separate paid option, unconnected to these reports, and its limit is plain: purchased hours or views do not count towards qualified watch hours, and the eligibility threshold itself is explained on the monetization requirements page. If you want to understand why a video is being distributed at all before reading the numbers, that is in the YouTube algorithm guide.
Audience retention and average view duration
This is the report that explains the others: a high click-through rate with low retention means a promise that was not kept, and the reverse means a good video nobody saw.
What retention actually measures
The retention curve answers one question: at every second of the video, what percentage of the people who pressed play are still there? It starts at the top and falls. The shape of the fall is the information.
Two numbers sit next to it in the Engagement tab. Average view duration is, in YouTube's own definition, the average minutes watched among those who stayed to watch, calculated from engaged views. Average percentage viewed is the share of the video they got through. The difference matters: YouTube's performance FAQ says the discovery system uses both absolute and relative watch time as signals, and that relative watch time is broadly more important for short videos while absolute watch time matters more for longer ones.
This page is about reading and improving the curve. Turning those minutes into qualified hours and the 4,000-hour requirement belongs to the watch time and watch hours guide, and the rest of the Studio reports live in the YouTube Analytics guide.
Where the report lives and when it appears
- Sign in to YouTube Studio and select Content in the left menu.
- Open the video, then select Analytics.
- Go to the Overview or Engagement tab and find the Audience retention report.
- Click SEE MORE to expand it, compare your video with all YouTube videos of similar length, and pick a viewer group from the Segments drop-down.
The official conditions (read 21 August 2026): the retention report exists at video level only, never at channel level; the video must be at least 60 seconds long and have at least 100 views; and retention data typically takes one to two days to process. Note as well that a video will not necessarily show all four moment types. YouTube highlights them only when it detects them.
The Segments report inside retention compares, per the same page, new against returning viewers, subscribers against non-subscribers, and organic against paid traffic for channels running ads. Some of that data needs Advanced Mode turned on. A detailed activity report also shows the absolute number of views across the video and how many viewers started and stopped watching at various moments.
Retention curve shapes
Graph shapes and what each one means
The official page describes the line in four states. The table pairs each with our practical reading.
| Shape | What the official page says | Practical reading |
|---|---|---|
| Flat line | Viewers are watching that part of the video from start to finish | That section works; keep its pacing and reuse the approach |
| Gradual decline | Viewers are losing interest over time; videos on YouTube generally taper off during playback | Expected; judge the speed of the decline against your own earlier videos, not against zero |
| Spike | More viewers are watching, rewatching or sharing that part | Open the video at that timestamp before you celebrate: enjoyable moment or unclear explanation? |
| Dip | Viewers are abandoning or skipping at that specific part | Look for the same dip across several videos before changing anything |
Key moments
The four moment types
Intros
By YouTube's definition, "Intro" tells you what percentage of your audience still watched your video after the first 30 seconds. A high percentage, per the official page, could mean the content in those 30 seconds matched the viewer's expectation of the thumbnail and title and kept the audience interested. Its two recommendations for a low percentage are explicit: change the thumbnail and title to better reflect the video's content, and modify the first 30 seconds, experimenting with different styles.
In practice a weak intro has two very different causes, and telling them apart is half the fix. Either the packaging pulled in the wrong audience and they left once they saw the real subject, which is the territory of the click-through rate page, or the audience was right and the first half minute gave them no reason to stay, which is a structural problem in the video.
Top moments
These are, in YouTube's words, moments where almost no one dropped off. The official recommendations: if they occur later in the video, introduce the compelling content earlier, because audience sizes typically decrease over the length of a video, and consider new content that expands on what worked there.
Spikes
The official page gives spikes two opposite readings: your audience watched that segment more than previous segments, or your content was not clear and your audience had to rewatch a section. So a spike is not praise until you have watched the moment. A spike right after a number or a technical step usually means "explain that again, more slowly". A spike on a funny beat means "more of this".
Dips
Dips highlight moments that were skipped or where viewers stopped watching completely, and YouTube suggests reviewing them to understand why interest dropped. The causes we see repeat: an introduction that describes what is coming instead of delivering it, greetings and channel promotion before any value lands, and padding after the core idea is done. Hunt for the dip that appears at the same stage across several videos; a single dip is usually noise.
What should you compare yourself against?
YouTube does not publish a "good" retention rate, and any figure you read in an article or an AI summary as "the benchmark" is a third-party estimate, not an official statement. The official report offers exactly two comparisons:
- Typical retention: a line you can use to compare a video with your 10 latest videos of similar length. This is your own baseline, and the most honest one, because it holds length and content type roughly constant.
- All of YouTube: clicking SEE MORE shows how your video compares to all YouTube videos of similar length. Useful as context, but it blends every format and every audience together.
Why does retention matter beyond the report? YouTube's search and discovery tips page names average view duration and average percentage viewed among the performance signals the system uses, alongside what people watch and ignore, likes, and post-watch survey results. The performance FAQ adds that what drives a decline in channel views is viewers stopping watching most of your videos when they are recommended. No weight is published for any signal, and there is no secret percentage that unlocks recommendations.
Shorts retention: a different logic
On Shorts the decision happens in the first second or two, and leaving means a swipe to the next Short. YouTube's discovery tips page for the Shorts feed names its signals: the percentage of viewers who chose to view, average view duration and average percentage viewed. So a Short needs an opening that starts on the first frame with no run-up, one line explaining why it is worth staying for, and an ending that leaves no dead air inviting a swipe. The detailed retention report also needs at least 60 seconds, so very short Shorts are judged more by average percentage viewed than by the curve.
Traffic sources
Traffic sources: where your audience comes from
The "How viewers find your videos" report splits traffic, per the official page, into YouTube search, browse features (Home, Subscriptions and similar), suggested videos, external, channel pages and others. Shorts get a parallel report that starts with the Shorts feed. At video level, the Reach tab adds detail cards: the search terms people arrived with, the suggested videos that sent them, and the playlists that drove traffic.
The reading we use: compare the source mix of a strong video with a weak one of the same type. If the strong one lives on "suggested" and the weak one only on "search", the difference is usually how well it connects to other content, not the title. If most of your watch time comes from channel pages and subscriptions, your audience is loyal but new-viewer reach is thin; that is where the Reach tab's "Impressions and how they led to watch time" report helps, since it shows, per YouTube, what share of impressions came from YouTube recommending your videos.
Audience: new, casual and regular viewers
The Audience tab shows your monthly audience: total unique viewers in the last 28 days, which YouTube suggests using to estimate the size of your active audience. It splits them into three groups with precise definitions ("Understand new, casual, and regular viewers", read 21 August 2026):
- New viewers watched your content for the first time. Anyone watching from a private browser, who deleted their watch history, or who hasn't watched your channel in over a year counts as new.
- Casual viewers watched your channel at least once per month for one to five months in the past year.
- Regular viewers watched a video on your channel at least once per month for more than six months in the past year; YouTube calls them your most loyal audience members and usually a smaller share of the monthly audience.
The same page says these segments do not affect reach or monetization; they are a content-planning tool. Data covers the last 7, 28 and 90 days and updates every one to two days. In practice: if regulars stay few while new viewers keep pouring in video after video, the content attracts but doesn't hold, and the usual fix is series and playlists that push a next watch. The growth pages in the YouTube growth and analytics guide take that further.
The same tab holds "When your viewers are on YouTube", which shows when your viewers are online across YouTube over the last 28 days; YouTube suggests it for scheduling Premieres and live streams. There is no official universal best time to post; this report is the source, and the best time to post on YouTube page explains how to use it.
Playlists and session time
Playlists do not raise the view counter directly, but they raise something that matters more: session length, meaning how long the viewer stays on YouTube after your video.
Why playlists matter to creators, not just viewers
YouTube's help page defines a playlist simply as "a collection of videos" that anybody can make and share. The creator-side difference is what plays next. Inside a playlist, the next item is yours; outside one, it is whatever the recommendation system picks. In practice, a viewer who found episode two through search may finish episode three and four without leaving your channel.
That is the link between playlists and watch time: longer sessions on your content mean more watch hours on your channel, the metric explained in the watch time and qualified watch hours guide. Playlists don't create demand from nothing; they route the viewer you already have to the next step. They sit alongside the other levers collected in the YouTube growth and analytics guide.
How to tell whether playlists are working
YouTube counts an impression when a thumbnail is shown for more than one second with at least 50% visible, and the list of places where impressions are counted includes playlists. So the "Impressions and how they led to watch time" report under the Content tab in Analytics reflects part of what your playlists do. Also compare session length and watch time on videos that live inside playlists against those that don't, over weeks rather than days.
There is no official figure for how many views a playlist adds; any percentage you read in third-party articles is that author's estimate. The right measurement is a comparison inside your own channel.
A weekly reading routine that leads to decisions
This is an editorial suggestion, not an official recommendation, but it stops you drowning in numbers:
- Once a week, Overview on 28 days: views, watch time and subscribers against the previous period. The direction matters more than the figure.
- Per video, after a week: impressions and CTR (Reach), then average view duration and the retention curve (Engagement). A high CTR with a short view duration means, per YouTube's CTR page, that the title or thumbnail promised more than the video delivered.
- Monthly, the Audience tab: the share of returning and regular viewers, whether it is improving, and watch time from subscribers.
- Before planning content: the Trends tab and the search-terms card in Reach; those are real ideas from your own audience.
And keep YouTube's line from the CTR FAQ in mind: half of all channels and videos on YouTube have an impressions CTR between 2% and 10%, and new videos or those with few views can swing wider. That describes a distribution; it is not a target to chase.
Frequently asked questions
How do I find my YouTube Analytics?
Open YouTube Studio on desktop or in the app, then choose Analytics from the menu. For a specific video, go to Content, hover over the video and pick Analytics. No external tool is needed to see your own data.
What is a good percentage for any YouTube metric?
There is no official number. YouTube only says half of channels have a CTR between 2% and 10%, and its retention report shows "typical retention" for your own last ten videos of similar length as a comparison line. Your channel's baseline is the reference.
Why are my view or subscriber numbers not moving?
Per "How engagement metrics are counted", YouTube verifies that views, likes and subscriptions come from real people and may slow, freeze or adjust a count temporarily. A short freeze after publishing is normal.
Does YouTube Analytics show my earnings?
Yes, in the Revenue tab, but only for channels accepted into the YouTube Partner Program. Channels outside the program do not see that tab.
Can I see another channel's analytics?
Only what is public: subscriber counts and video views. Third-party stats sites build their estimates on those public numbers alone.
Practical summary
- Open Analytics with a specific question and read the tab that answers it: Reach for discovery, Engagement for staying, Audience for loyalty.
- After 24 August 2026, compare watch time and average view duration before view counts.
- No metric has an official benchmark; compare against your own channel.
- Third-party tools for other channels, YouTube Studio for yours.
- For the rest of the YouTube guides, start at the YouTube Resource Hub.
Official sources
- Get started with YouTube Analytics: the seven tabs and channel- vs video-level access (read 21 August 2026).
- Get an overview of channel performance: Realtime report, 60-minute vs 48-hour comparison (read 21 August 2026).
- Understand your YouTube content performance: 24 August 2026 view-count change, Content tab, traffic-source reports (read 21 August 2026).
- Understand your YouTube audience: monthly audience, returning and new viewers, when your viewers are on YouTube, watch time from subscribers (read 21 August 2026).
- Understand new, casual, and regular viewers: segment definitions and data ranges (read 21 August 2026).
- Check your YouTube impressions and watch time: the "Impressions and how they led to watch time" report (read 21 August 2026).
- Understand your YouTube engagement: average view duration definition, end screen element click rate (read 21 August 2026).
- Impressions and click-through-rate FAQs: the 2% to 10% range and the clickbait warning (read 21 August 2026).
- How engagement metrics are counted: metric verification and temporary freezes (from the source register, 18 August 2026).
- YouTube Partner Program overview and eligibility: 1,000 subscribers and 4,000 qualified watch hours in 12 months, the Shorts-feed exclusion, the February 2027 banner, review time (read 21 August 2026).
- Changes to the YouTube Partner Program: 8,000 hours or 20 million Shorts views for new creators from 1 February 2027; the 500-subscriber tier unchanged (read 21 August 2026).
- YouTube performance FAQ and troubleshooting: appropriate video length, relative vs absolute watch time, seasonality and competition (read 21 August 2026).
- Measure key moments for audience retention: the report path, the 60-second and 100-view conditions, the four moment types, graph shapes, segments, typical retention (read 21 August 2026).
- Search and discovery tips: average view duration and average percentage viewed among performance signals (from the source register, 18 August 2026).
- Discovery tips for the Shorts feed: percentage of viewers who chose to view, average view duration, average percentage viewed (from the source register, 18 August 2026).
- Create & manage playlists: creation steps from a video or Short, privacy, the daily public-playlist limit, reordering, filtering and deletion (read 21 August 2026).
- Customize your YouTube channel layout: up to 12 custom Home tab sections, the Playlists section and its types (read 21 August 2026).
- Navigate YouTube Studio: what Studio is, the five sections of the mobile app, and the video filters (read 21 August 2026).
- Use the YouTube Studio dashboard: the dashboard cards and which notification types do and do not appear (read 21 August 2026).
- Explore Inspiration tab on YouTube: the cards, nine ideas, desktop-only and English-only limits, and the accuracy warning (read 21 August 2026).
- Learn about comment settings: moderation levels, the 60-day hold, hidden and approved users (read 21 August 2026).
- Add subtitles and captions: the Subtitles path and the three ways to add captions (read 21 August 2026).
- Use the Copyright Match Tool: the Content detection section, the Matches tab and the available actions (read 21 August 2026).
- Use music and sound effects from the Audio Library: where it lives, filters, attribution and the limits of "copyright-safe" (read 21 August 2026).