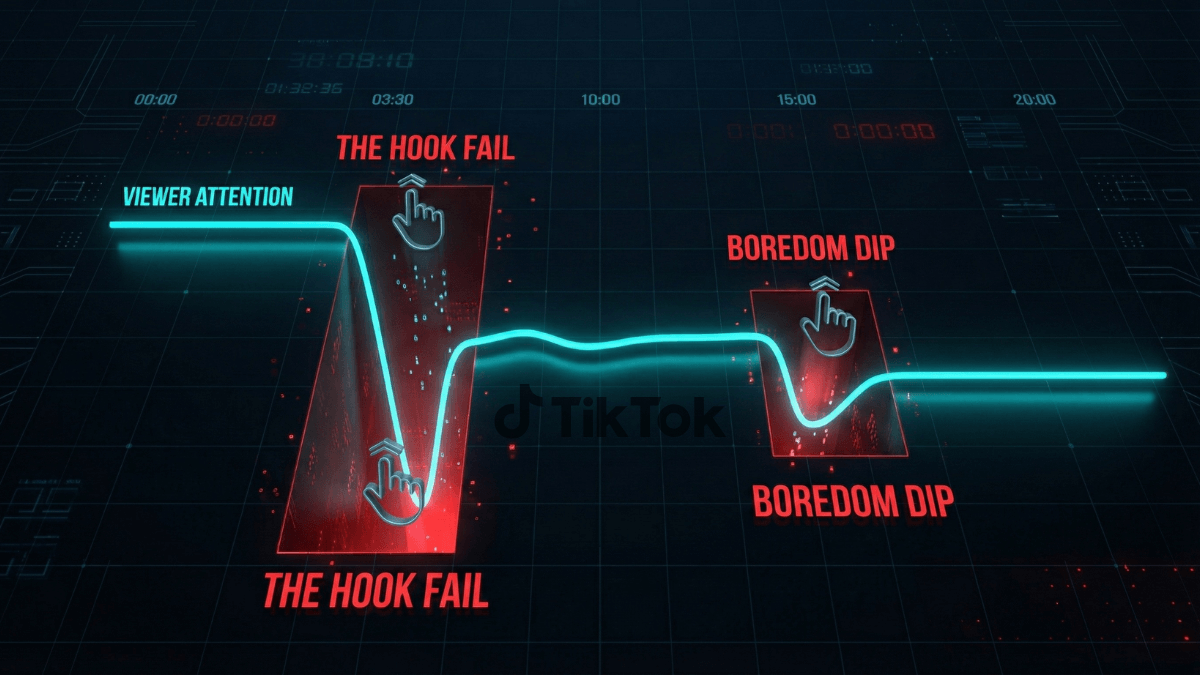
Viewers stop watching your videos at specific, diagnosable moments — not randomly. Six main drop-off points: weak hook (first 3 seconds), post-hook collapse (seconds 4–10), pacing breakdown (mid-video), filler and repetition, actual early ending (video effectively ends before its technical end), and no reason to rewatch. Each point has a different diagnosis and a different fix.
| Drop-Off Point | Typical Timing | Core Cause | First Fix |
|---|---|---|---|
| 1. Weak hook | 0–3 seconds | No curiosity, no reason to stay | Rewrite the opening line + first frame |
| 2. Post-hook collapse | 3–10 seconds | Hook promised something that wasn't delivered | Make seconds 4–8 deliver on the hook's promise |
| 3. Pacing breakdown | 20–40% into the video | Pacing slowed or information stopped | Remove pauses, add a new piece of info every 7–10 seconds |
| 4. Filler and repetition | Anywhere | Viewer realized you're adding no new value | Cut every sentence that adds no new information |
| 5. Actual early ending | 50–80% through the video | Video ended logically before its technical end | Cut the video here in the next version |
| 6. No reason to rewatch | After the end | No element pushes a second viewing | Add a loop element or surprise ending that drives rewatch |
Key Takeaways
- Audience Retention in TikTok Studio is the map that shows you exactly where your viewers leave — don't diagnose without it.
- The most impactful drop-off point is the first one (the hook) — because it determines who completes everything after.
- Mid-video pacing breakdown is an editing problem, not a content problem — the fix happens in the edit room.
- A gradual continuous decline diagnoses differently from a sharp drop at a specific point — each pattern has a different fix.
- The goal isn't zero drop-off — it's turning sharp drops into natural gradual ones.
How Do You Read Audience Retention to Identify a Drop-Off Point?
If you're a TikTok creator noticing low completion rates and wondering where you're losing viewers, this guide gives you a diagnostic framework for every pattern. According to TikTok's Analytics Help Center, Audience Retention in TikTok Studio is the primary tool for understanding viewer behavior at the individual video level. Open TikTok Studio, select any video published at least 48 hours ago, and navigate to Analytics then Audience Retention.
Basic reading:
- Horizontal axis: time from start to end of the video
- Vertical axis: percentage of remaining viewers (100% = everyone who started watching)
- Gradual decline: normal — not everyone completes any video
- Sharp drop: signals a diagnosable and fixable drop-off point
The Core Diagnostic Rule
A smooth gradual decline = viewers completing with varying levels of interest — normal and acceptable. A sudden sharp drop at a specific moment = something happened at that moment that pushed viewers to scroll — this is the diagnosable and fixable drop-off point.
TikTok does not publicly disclose specific benchmarks for what counts as a "good" completion rate — this varies by niche and video length. For a deep dive into what completion rates mean and what counts as a good rate in your niche, see our article on what's a good retention rate on TikTok. For how these signals affect distribution in the TikTok algorithm, see our article on algorithm signal priorities.
Why Do Viewers Leave in the First 3 Seconds and How Do You Fix It?
Graph shape: very sharp decline in the first 3 seconds — the line drops steeply from 100% then levels off relatively after that.
Why It Happens
The hook didn't create any reason to stay. The viewer scrolling through the FYP found nothing in the first two seconds that answered their implicit question: "why should I watch this right now?" Most common causes:
- An introductory preamble ("Hi, I'm...") instead of starting in the middle of the idea
- Static camera and unexpressive face in the first frame
- First on-screen text generates no curiosity
- No visual element to stop the scroll
The Fix
- Rewrite the opening line to create an immediate question or tension
- Start the video in the middle of the action — not from an introduction
- Add strong movement or a visual expression in the very first frame
- Place on-screen text that communicates the video's value within the first second
For the complete guide to building an effective hook, see our comprehensive TikTok hooks guide.
Why Do Viewers Leave Right After the Hook and How Do You Fix It?
Graph shape: good opening in the first 3 seconds, then a sharp drop between seconds 4 and 10 — the hook succeeded in stopping the scroll but something immediately after lost the attention.
Why It Happens
This means your hook was good — but what followed immediately didn't hold that interest. Most common causes:
- The hook promised something specific but seconds 4–8 didn't deliver on it
- Sudden transition to a different subject immediately after the hook
- Poor audio or background noise discovered in the first few seconds
- Self-introduction or topic introduction immediately after the hook — breaking the momentum
The Fix
Seconds 4–8 Must Answer "So?"
If your hook was "nobody told you this about TikTok" — then seconds 4–8 must start directly answering: "the reason is that the algorithm evaluates..." not "but first let me introduce myself..." The momentum must continue without interruption.
How Does Pacing Breakdown in the Middle Drive Viewers Away?
Graph shape: good start, then a sharp decline somewhere between 20–50% of the video — the pacing slowed at that moment.
Why It Happens
- Long pause between points — silence or hesitation while speaking
- A setup sentence or tangent that adds no value
- A slow clip transition or a waiting moment not cut in editing
- Repeating information already covered in the same way
- Camera moving or angle changing in a distracting way
The Fix
This is usually an editing problem, not a content problem:
- Cut all pauses and filler words: jump cuts remove these pauses and maintain high pacing
- The 7–10 second rule: every 7–10 seconds must deliver a new piece of information or a clear shift — auditory or visual
- Replace tangents with text: if you want to add context — put it as on-screen text rather than additional spoken words
How Do Filler and Repetition Push Viewers to Stop Watching?
Graph shape: continuous gradual decline from the video's start — not a sharp drop at one specific moment but steady erosion throughout the video.
Why It Happens
The viewer holds you accountable for every second that doesn't add value. Filler takes multiple forms:
- Restating the same idea with different words more than once
- Long setups before each point ("now I'm going to talk about...")
- Sentences that wrap up the content before the video actually ends ("and so as you can see...")
- Unnecessary examples for something already clearly understood
The Fix
The "What If I Cut This?" Test
For every sentence in your video, ask: "if I cut this sentence, does the viewer lose necessary information?" If the answer is "no" — cut it. This simple test removes 30–50% of filler in most videos without losing any value.
What Is the Actual Early Ending and How Do You Spot and Fix It?
Graph shape: the line stays high until some point (say 70% through the video) then drops sharply — not a gradual decline but a sudden fall.
Why It Happens
The actual content ended logically at that point — but the video continued. Everything after the fall point is content that outlasted its natural impact. Causes:
- The summary or CTA came too early and made the viewer feel the video was over
- The last and strongest idea was delivered in the middle of the video, not at the end
- The video is longer than the content can justify
The Fix
- Cut at the drop point: in the next similar video, end where the graph fell — not where the technical video ended
- Delay the strongest information: the most important point should be in the second half, not the first
- Loop hook: add a sentence or element at the end that connects back to the opening — pushes viewers to rewatch to understand the connection
Why Does the Absence of a Rewatch Trigger Weaken Algorithm Signals?
Graph shape: the line reaches the end but rewatch rate is low — the video was completed but not rewatched.
Why This Matters
According to TikTok's official recommendation system documentation, rewatching is a very strong algorithmic signal — it means the viewer saw enough value to reinvest in the same video. High-rewatch videos receive additional distribution even days after publishing.
What Generates Rewatches
- Information density: a very information-dense video makes the viewer want to rewatch to catch what they missed
- Loop hook: an ending that circles back to the beginning unexpectedly — viewers rewatch to understand the connection
- Surprising punchline: an ending the viewer didn't expect makes them rewatch to check if they missed something
- Visual transformations: before/after videos get rewatched for comparison
What Do Different Audience Retention Patterns Tell You?
Rather than reading raw numbers, here are the common Audience Retention graph shapes and what each one means:
| Graph Shape | What It Means | The Problem | The Fix |
|---|---|---|---|
| Sharp drop in first 3 seconds then levels off | Weak hook — many don't make it past the third second | Weak hook | Rewrite the hook with a different formula |
| Good start then sharp fall at seconds 5–10 | Hook worked but what followed killed the momentum | Post-hook gap | Make seconds 4–10 directly deliver the hook's promise |
| Continuous gradual decline from start | Video is longer than the audience's capacity to continue | Filler or excessive length | Reduce overall length and cut filler |
| Stable then sharp drop in the middle | Something specific at that moment broke the momentum | Weak spot in the middle | Identify exactly what happened at that moment and cut it |
| Stable until 70–80% then sharp fall | The content actually ended before the technical video end | Actual early ending | Cut the video at the drop point |
| Smooth curve with slight uptick at the end | Strong video generating rewatches | No problem — ideal pattern | Replicate the same structure in similar videos |
For understanding what the specific percentages mean and what counts as a good completion rate in your niche, see our article on what's a good retention rate on TikTok. For how these signals affect your video distribution, see our guide on how TikTok's algorithm tests your video. And if you're experiencing an overall views drop alongside low completion, see our guide on why TikTok views drop suddenly.
What Do Creators Ask About Why Viewers Stop Watching TikTok Videos?
Is it normal for the completion rate to drop in the first few seconds?
Yes — some drop-off in the first 3 seconds is normal because FYP viewers include people with varying degrees of initial interest. The problem is when this drop is very sharp — it means the video failed to stop the scroll even for those who started watching. The goal is reducing the steepness of this drop, not eliminating it completely.
Should I change my short videos since they have high completion but low views?
High completion on a short video is a positive thing — but low views mean the initial test batch was small or the hook didn't stop the scroll effectively enough. The solution isn't changing the length but strengthening the hook and making the value clearer in the first two seconds. High completion rate is something to build on — don't change what's working.
Does completion rate need to be 100% for good reach?
No — 100% completion is near-impossible and not expected. The goal is completion higher than your niche's average — which varies by niche and video length. A video with 60% completion in a niche where the average is 30% performs excellently. Relative performance matters more than the absolute number.
Can I fix an existing published video with low completion?
You can't edit a published video and change its accumulated signals — the algorithm evaluates signals built up since publishing. What you can do is learn from the Audience Retention graph and produce a better video on the same topic. A second video on the same topic but with a better hook and pacing almost always performs significantly better.
Do viewers leave the same way in short and long videos?
The patterns differ. In short videos (under 30 seconds), a sharp early drop is the most common scenario — the hook is everything. In long videos, gradual decline is normal but sharp drops at specific mid-video points signal a clear identifiable problem. Different lengths change where you look for the problem, not whether a problem exists.
Conclusion
Viewer drop-off isn't random — it's a diagnosable response to six specific, identifiable points. The diagnostic tool is right there in TikTok Studio under Audience Retention. Start with the hook because it determines who completes everything after, then work through each sharp drop point you find in the graph. TikTok does not publicly disclose specific thresholds for each signal — but many creators consistently find that improving pacing and reducing filler produces measurable gains in completion rate within two weeks.
To build a content strategy that improves algorithm signals overall, see our TikTok FYP strategy guide. For the full picture of what the algorithm evaluates in each video, see our article on TikTok algorithm signal priorities.