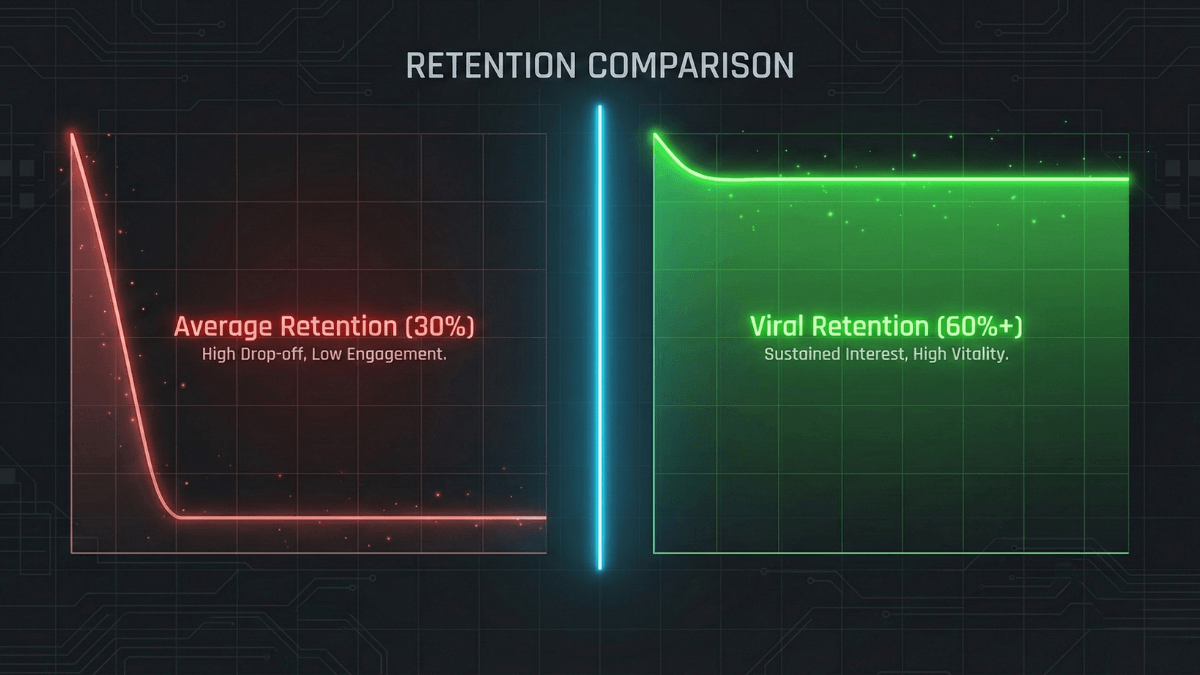
This page is for: interpreting your own retention number against video length and traffic source, not chasing one fixed percentage that gets called "good" regardless of video type.
You open the video's analytics and see 45% retention. Good or bad?
Direct answer: Retention rate is TikTok's term for "the percentage of your video that users watched," and TikTok publishes no number it considers good, not in Creator Academy and not in the Help Center. In practice, a good rate is the one that holds up or improves against your own recent videos in the same length band and format. Every tier table you have seen (60% is good, 70% goes viral) is its publisher's estimate, not a platform standard. Nothing about a single percentage unlocks distribution.
This page teaches you to read the number and decide from it. It sits inside the TikTok analytics path, and the same behaviour measured in seconds belongs to TikTok watch time.
Jump to: What TikTok says · Three numbers people mix up · Is 30% good? · Why every site differs · Build your baseline · Worked example · Reading the curve · Why viewers leave · Traffic source · Retention vs rewatch · What to do next · FAQ · Practical Summary · Official Sources
Key Takeaways
- TikTok defines retention rate but publishes no "good" number and no official tier table; every tier table you read is its publisher's estimate.
- Your good number is your own normal for that type of video in that period, measured against three tests: your baseline, video length, and the video's job.
- Convert every figure to a ratio (average watch time ÷ length) before comparing videos of different lengths.
- The curve tells you where the drop happened; the video itself tells you why. Neither is enough alone.
- Build a baseline from 5-10 comparable videos, and test exactly one hypothesis per publishing cycle.
What TikTok actually says about retention rate
Documented by TikTok: Creator Academy defines retention rate as the percentage of your video that users watched. It tells you to find the dropoff point in the graph, then go back to the video and check what was on screen at that moment: the line you were saying, the on-screen text, a transition. That is the thing that could explain the loss of interest.
That is the entirety of the official guidance. No target percentage. No poor/average/good/great tiers. No completion threshold that opens up reach. How TikTok recommends content adds that time spent watching and watching in full are among the user interactions that influence recommendations, and that strong indicators such as a video watched to the end carry more weight than weak ones. That is a mechanism, not a number.
Practical reading: when a platform defines a metric and declines to publish a standard for it, the only valid standard available to you is your own account.
Three numbers people mix up
Before you judge any figure, separate three different things:
| Metric | Question it answers | Common mistake |
|---|---|---|
| Average watch time | How many seconds did the average play produce? | Comparing raw seconds across different video lengths |
| Watched full video | How many plays reached the end? | Applying one percentage to every length and format |
| Retention curve | Where did viewers leave or stabilise? | Guessing the cause from the shape without reviewing the video |
Total watch time sits above all three. It grows with reach volume, so it never works alone as evidence of quality.
These metrics are related. They're not interchangeable. An 8-second clip reaches a high completion percentage far more easily than a 60-second explainer, without being the better video.
Is 30% retention good on TikTok?
There is no answer as a number, but there is an answer as three tests. Run your figure through them in order.
- Against your own baseline. What did your last five to ten comparable videos do? If 30% is your normal, you are looking at ordinary performance, not an emergency. If your normal is 45%, the real question becomes what changed in this video.
- Against length. 30% of a 15-second video is about 4.5 seconds, which means most people left before your first sentence finished. 30% of a two-minute video is 36 seconds, which is enough time to deliver a complete idea. Same percentage, two completely different readings.
- Against the video's job. A curiosity-driven clip that ends on a quick answer is judged on completion. A reference video people return to is judged on saves and shares more than on a percentage.
Practical reading: the number worth worrying about is the one that dropped clearly below your own normal and repeated across more than one video, not the one that looks low next to a chart you read somewhere else.
Why every site publishes a different benchmark
Search this question and you will find pages publishing precise-looking bands: this is good, this is strong, this is exceptional. The bands differ substantially from site to site, and not one of them cites a TikTok document. Each publisher generalises from its own tool data or client sample, and the next site copies the figure with no source at all.
Circulating theory: the most widespread version is "70% is now required, up from 50% in 2024." It appears across multiple sites in near-identical phrasing: a specific number, a timeline narrative that manufactures urgency, and zero official citations. TikTok has never announced a raised completion threshold, and has never published a completion threshold to raise.
A second pattern repeats across the same search results: sites that describe one percentage as "the primary metric TikTok's algorithm uses to determine distribution," tying a specific number to phrases like "triggers strong algorithmic distribution." That is a direct causal claim linking a single figure to a distribution decision, and it goes well beyond what TikTok's documentation states. TikTok describes completion as a weighted interest signal inside a broader context, not a distribution switch on its own.
A trap worth flagging: searching this question can surface a page on TikTok's own domain titled something close to "What Is a Good Retention Rate on TikTok." That page is an auto-aggregated collection of creator videos discussing the topic, not a policy document or a published standard, even though the link looks trustworthy because it sits on tiktok.com. It doesn't count as an official source, which is why it isn't listed under Official Sources below.
Your rule is simple. For any number in this space, ask two questions before you act on it: who exactly said it, and from what data. A quick way to tell a documented source from an undocumented one: a real citation links directly to a page on creator-academy or support.tiktok.com that states a definition or a policy, not to a video aggregation page or a third-party comparison chart. If that link is missing, treat the figure as its publisher's estimate rather than a platform standard, and fall back to the baseline you build from your own account in the next section.
Build a baseline from your own account
This is the most valuable ten minutes on this page, and you only do it once:
- Pick five to ten videos with similar length, format, and objective.
- For each one record: length, average watch time, watched-full percentage, and where the first clear drop happens on the curve.
- Calculate average watch time ÷ length for each. That ratio is what lets you compare a 20-second video with a 90-second video fairly.
- Drop the new video into the same set and compare.
- Add the objective metric: saves, shares, profile visits, or whatever result you actually wanted.
The output is not "this is a good TikTok retention rate." The output is "this is the current normal range for this type of video on my account, this month." That is a sentence you can act on.
A note on the time window: TikTok Studio shows analytics over selectable fixed ranges (7, 28, 60, and 365 days, or a custom report), so an account trend across 28 days is a different question from one video's number. Do not mix them. The available ranges vary by app version, so check yours.
A worked example, start to finish
Hypothetical example. These numbers illustrate the arithmetic; they're not a benchmark and not a real account.
A 60-second video. Average watch time 27 seconds. Watched full video 31%.
- 27 ÷ 60 is 45%. On average, viewers saw a little under half the video.
- The gap between 45% average and 31% completion is normal: some people left early, some finished, and the average lands between them.
- Open the curve. If the biggest drop is inside the first three seconds, the problem is the promise and the opening, which is hook work.
- If the curve holds to second 40 and then collapses, the problem is the last stretch: a long outro, or value that completed before the video did. The decision is to cut the ending, not rewrite the video.
- If 45% is your normal for this format, this video is fine and your real question is reach, not retention. That question belongs to why your TikTok views are low.
One step separates "the number looks bad" from "I know what to change."
How to read the curve shape
Start with the shape, then go back to the video at that exact second, which is what TikTok's own guidance asks you to do.
Sharp drop in the first seconds
The viewer's expectation did not match what appeared fast enough, or the opening spent time before delivering value. That is a signal to investigate, not proof that the opening alone caused it: traffic source and audience match both feed into the reading.
A drop at one specific point
Check what happened at that second: a slow transition, a repeated point, an unexplained term, a shot that doesn't serve the idea, or value that completed before the video ended. This is the easiest case, because the problem is local and cuttable.
Stable middle, weak ending
The interested audience stayed, but the ending ran longer than it needed to or the conclusion arrived early. Review the content before deciding to shorten everything you make.
Flat and low from start to finish
This happens when a short video reaches an audience with no interest in the subject. Check sample size before concluding anything: a few dozen plays won't support a verdict.
Why viewers actually leave
These are the repeat causes, and each leaves a different signature on the curve:
- The promise is unclear. The viewer never learned what they were going to get. Signature: an immediate drop.
- The promise is clear but delivery is late. The intro explains before it gives. Signature: a gradual slide through the first quarter.
- High cognitive load. Fast delivery, small text, several steps at once. Signature: a drop at one specific step.
- The value completed. They got the answer and left, which isn't necessarily a failure. Signature: a drop immediately after the payoff moment.
- Audience mismatch. The video reached people outside the topic. Signature: a low flat curve with an unusual traffic source.
- A technical problem. Low audio, text colliding with the interface, a poor upload. Signature: an early drop the content doesn't explain.
Practical reading: the curve tells you where. The video tells you why. Neither is enough alone.
Traffic source changes the reading
A viewer from search arrived with a specific expectation. A For You viewer is usually meeting the subject for the first time. The same video produces two different curves depending on who it reached.
An early drop on search traffic usually means the caption promised an answer the video did not start with. The same drop on new discovery traffic can mean the topic was narrower than the audience it reached. Where traffic sources are available in your analytics, use them as context rather than as a separate verdict.
Retention rate vs rewatch rate
Two related metrics answering different questions. Retention rate measures how much of the video people watched before leaving. Rewatch measures how many came back for a second play after finishing.
The distinction matters in practice: a short video with a detail that needs attention can pull heavy repeat viewing, which is why total watch time can exceed the video's own length per viewer. That is real interest, and it still does nothing about a drop in the first two seconds. Fix the opening first, then read repeat viewing as an addition.
What to do after you read the number
This page owns interpretation. Execution starts with exactly one hypothesis, not five edits at once:
- "I will lead with the result before the background."
- "I will cut the repetition in the middle."
- "I will test a shorter version of the same idea." The length decision itself belongs to choosing your TikTok video length.
- "I will make the promise explicit in the first sentence." The wording belongs to TikTok hooks.
Publish two or three videos on the same hypothesis, then compare inside the same set. One change per cycle, or you won't know which one worked.
Frequently asked questions
Is there a retention rate that makes a video go viral?
No. TikTok publishes no percentage that unlocks distribution. Viewing behaviour is one input inside a broader recommendation context that also includes engagement, video information, and account and device settings.
Is 96% audience retention good?
Read it against length before celebrating it. 96% on a 6-second loop is close to structurally automatic, and it says little about whether the idea landed. The same figure on a 90-second explainer is exceptional and worth studying: check what that video did differently and whether the objective metric (saves, shares, profile visits) moved with it.
Which matters more, completion rate or average watch time?
It depends on your question. Completion tells you whether viewers reached the end. Average watch time tells you how much of their time the video took. Read both against length and curve shape; the seconds themselves belong to TikTok watch time.
Can I compare a 10-second video with a one-minute video?
Not directly. Convert both to a ratio (average watch time ÷ length) first, and preferably compare within the same length band and format.
Does an early drop prove the video is bad?
No. Check sample size, traffic source, promise alignment, and what actually happens in the first two seconds. The curve tells you where to look; it doesn't prove the cause.
Does retention look different over 28 days instead of one video?
Yes, and the difference matters. The time window gives you a trend across many videos, not an interpretation of one. If the trend declines over weeks while individual videos look normal, your question is about the content pattern, not about any single post.
Does deleting weak videos improve my account's numbers?
Nothing documents that, and the details are in does deleting a TikTok video hurt your account. Save a video's analytics before deleting it, because you are deleting part of your own baseline.
Do view services raise retention?
No. Retention is a ratio computed from actual viewing behaviour inside the video, while view services change the displayed count according to the service selected. The reading method on this page depends on no service at all.
Practical Summary
- TikTok defines retention rate and publishes no "good" number. Every tier table you read is its publisher's estimate.
- Your good number is your own normal for that type of video, in that period.
- Convert everything to a ratio (average watch time ÷ length) before any comparison.
- The curve says where, the video says why. Open both together.
- One hypothesis per cycle, then compare inside the same set.
Your next step: open your last five comparable videos, record length, average watch time and watched-full percentage in one table, and calculate the ratio for each. That is your baseline, and it is the only number worth measuring against.
The rest of the TikTok guides are collected in the TikTok Resource Hub.
Official Sources
- TikTok Creator Academy: retention rate defined, and reading the dropoff point
- TikTok Creator Academy: reading video performance
- TikTok Support: Understanding your analytics in TikTok Studio
- TikTok Support: How TikTok recommends content
- TikTok Support: TikTok Studio
- TikTok Support: My posts aren't getting views