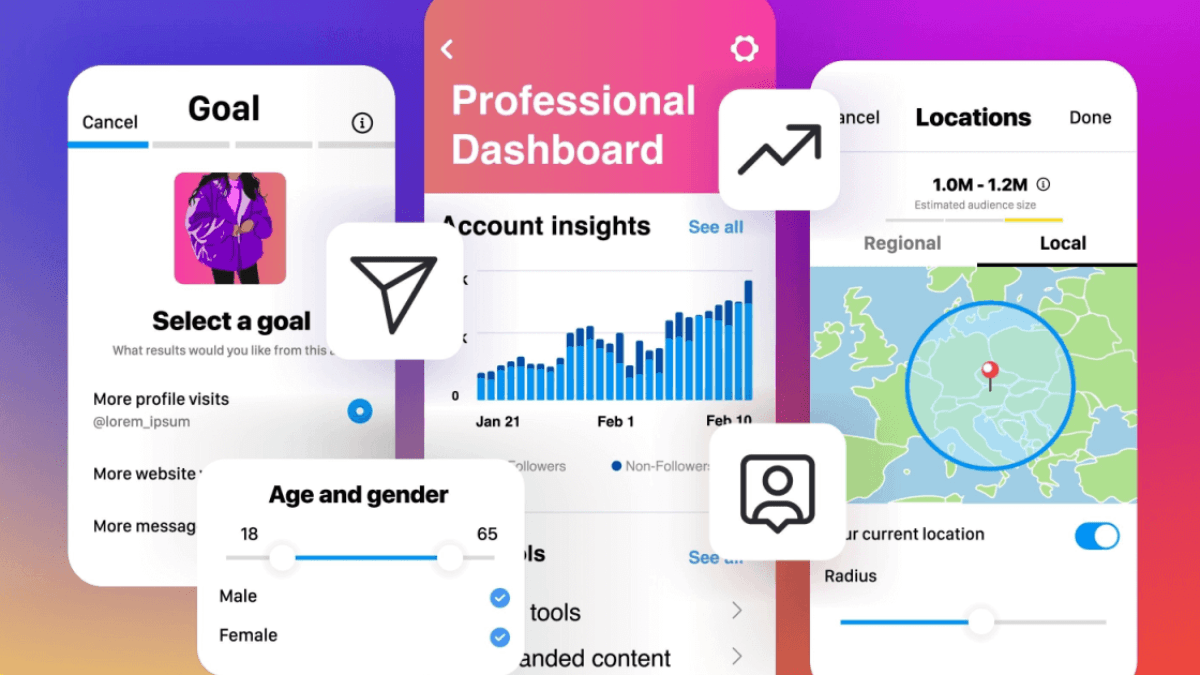
The direct answer: Instagram measurement starts with the free Insights panel, which is available on any public account, personal or professional. It answers three questions and no more: who saw this, who did something about it, and who followed as a result. Everything past that (third-party tools, competitor comparison, engagement-rate benchmarks) is optional and mostly third-party. Instagram itself publishes no benchmark for a good engagement rate.
1. Where Instagram measurement starts
The common mistake is starting with tools. Start with the panel you already have. Insights is free, in-app, and available on any public account. The official Help Center page says so explicitly for both personal and professional public accounts. The only thing gated to professional accounts is paid promotion.
If your account is private you will not see Insights at all. If you switch back to private you lose access, and you can regain your past data if you switch back to public within 90 days.
2. The three questions worth measuring
Instead of chasing every number, attach each number to a question:
- Did it reach anyone? Views, Viewers, and the split between followers and non-followers.
- Did it do anything? Interactions and Accounts engaged.
- Did it build anything? New followers.
If a number does not answer one of those three, it is decoration. Track it later, if it ever earns a question.
3. Instagram's current metric vocabulary, and what changed
Instagram renamed its metrics, and most published guides still use the old names. This table reflects the official pages as read on 18 August 2026:
| Metric | What it counts | Where you see it |
|---|---|---|
| Views | How many times the content was viewed | Overview, and per post |
| Viewers | The accounts that viewed, with demographics | Overview |
| Interactions | Likes, comments, saves and shares | Overview |
| Accounts engaged | Split between followers and non-followers | Overview |
| New followers | Net growth over the period | Overview |
| Watch time and Average watch time | Reels only | Reel insights |
Worth flagging: "reach" and "impressions" are no longer the displayed metric names. Any guide still using them as current labels is out of date.
4. Engagement rate: the formula, and why published benchmarks disagree
Instagram publishes no good engagement rate. Every figure you see (2 percent, 3 percent, 6 percent) is a third-party benchmark calculated by a tool company across its own customer base.
The formula is simple. The denominator is what changes everything:
- Over followers: (interactions ÷ followers) × 100. Flatters small accounts.
- Over views: (interactions ÷ views) × 100. More honest for content that reaches non-followers.
- Over accounts engaged: measures depth rather than breadth.
That is why your number cannot be compared to a published figure unless it uses the same denominator over the same window. The comparison that works is against yourself: one formula, same day each month.
5. Competitor analysis: what you can actually see
From outside an account you can see: follower count, post count, which formats they use, their publishing rhythm, visible likes and comments, and how they structure their bio and highlights.
You cannot see: their views, saves, shares, watch time, where their reach came from, or their real engagement rate. Any tool showing you those numbers for someone else's account is producing an estimate from what is publicly visible, not a measurement.
Practical interpretation: use competitors as a source of format and topic ideas, not as a source of numbers.
6. How often to review your numbers
Aggregate Insights cover a maximum of 90 days, with five preset timeframes (7, 14, 30 and 90 days, plus a custom range inside those 90 days). Per-post metrics are kept for two years.
A workable rhythm: a quick weekly look at views and new followers, a serious monthly review over 30 days for formats and topics, and a quarterly look over 90 days for the trend. Daily checking wastes time and pushes you into making decisions on noise.
7. Where to go next
- Instagram Insights: the native panel screen by screen and metric by metric, including who can see it.
- Instagram analytics tools: when a paid tool is justified, and what any tool can actually access.
- Why your Reels views are low: the ordered diagnosis when the number is bad.
And if the question is why the content reached anyone in the first place, that is ranking rather than measurement: how the Instagram algorithm works.
8. When the numbers are not the problem
Measurement tells you what happened. It does not tell you why. If views, engagement and followers have all been flat for weeks, the cause is usually clarity of what you offer, format choice, or recommendation eligibility, none of which appear in the Insights panel. Do not re-read the same number expecting a different explanation.
9. Practical summary
Start with free Insights and attach every number to one of three questions. Pick one engagement-rate formula and keep it. Treat every published benchmark as a third-party figure, not as Instagram data. Review quickly each week and properly each month. Only when you need more than 90 days of history, cross-platform reporting, or client-ready exports does a paid tool start to earn its cost.
The rest of the Instagram library is collected in the Instagram Resource Hub.
10. Official sources
- Insights on Instagram: free on any public account, Views, Interactions and New followers, Accounts engaged split by followers and non-followers, boosting limited to professional accounts.
- Insights timeframes: any period within the past 90 days, five presets, two-year per-post retention, and the estimated and in-development metrics note.
- Reels insights: Views, Watch time, Viewers, Average watch time, Follows.
- Stories insights.
- Instagram ranking explained (31 May 2023): what the systems optimise for, connecting metrics to distribution.