In April 2025, Instagram retired Impressions and Reel Plays and replaced them with Views as the unified metric across all content types. In April 2026, it added Skip Rate, Share Rate, and Views Over Time. This guide covers the complete current Insights map, what each metric actually means, and how to turn the numbers into content decisions.
| Metric | What changed | Date |
|---|---|---|
| Views | Replaces Impressions and Reel Plays — counts every view including replays | April 2025 |
| Skip Rate (Reels) | New — percentage who swiped away before completing the Reel | April 2026 |
| Share Rate | New — percentage of DM shares relative to Views | April 2026 |
| Views Over Time | New — content performance tracked over weeks, not just 24 hours | April 2026 |
| Retention Rate (Reels) | New — graph showing exactly where viewers drop off by second | 2025 |
| Impressions / Reel Plays | Fully retired — no longer appears on new content after April 2025 | Retired April 2025 |
- The complete Insights map: Overview / Engagement / Audience — what's in each section
- The core difference between Views and Reach — and which to monitor for which goal
- Format-specific metrics: Reels, Stories, and Carousels each explained separately
- A weekly review routine (4 metrics) and monthly review (3 strategic questions)
- A diagnostic framework: low reach / weak engagement / followers not growing
How to Access Instagram Insights
Instagram Insights is available to Professional accounts only (Creator or Business). Personal accounts have no Insights access — a conversion is required first.
- From the app: Your profile → Professional Dashboard → Insights — or tap "View Insights" directly below any post
- From the web: instagram.com → your profile → Insights (graph icon) — provides larger charts and deeper filtering options
- Data retention: 90 days maximum in native Insights — export your data regularly if you need a longer history
- Structure after the 2026 update: Three main tabs: Overview → Engagement → Audience
Views as the Primary Metric — What It Means and What It Doesn't
Since April 2025, Views is the unified primary metric across all content types. But Views alone isn't enough to understand performance — and confusing it with Reach is the most common mistake creators make.
| Metric | What it measures | When to monitor it | Example |
|---|---|---|---|
| Views | Total number of times content was viewed — includes replays from the same person | Comparing content against each other | 1,000 views could be only 800 unique people |
| Reach | Number of unique accounts that saw the content | Measuring actual spread | 800 distinct people saw the Reel |
| Views ÷ Reach | Average views per unique viewer | Identifying "rewatch" content (Loop effect) | Views/Reach = 1.5 means many viewers are replaying |
Mosseri confirmed: "Views are different from reach" — Views rises with every replay, which is a positive signal. But Reach tells you how many unique people your content actually reached. For more on how these signals affect the algorithm, see the complete Instagram algorithm guide.
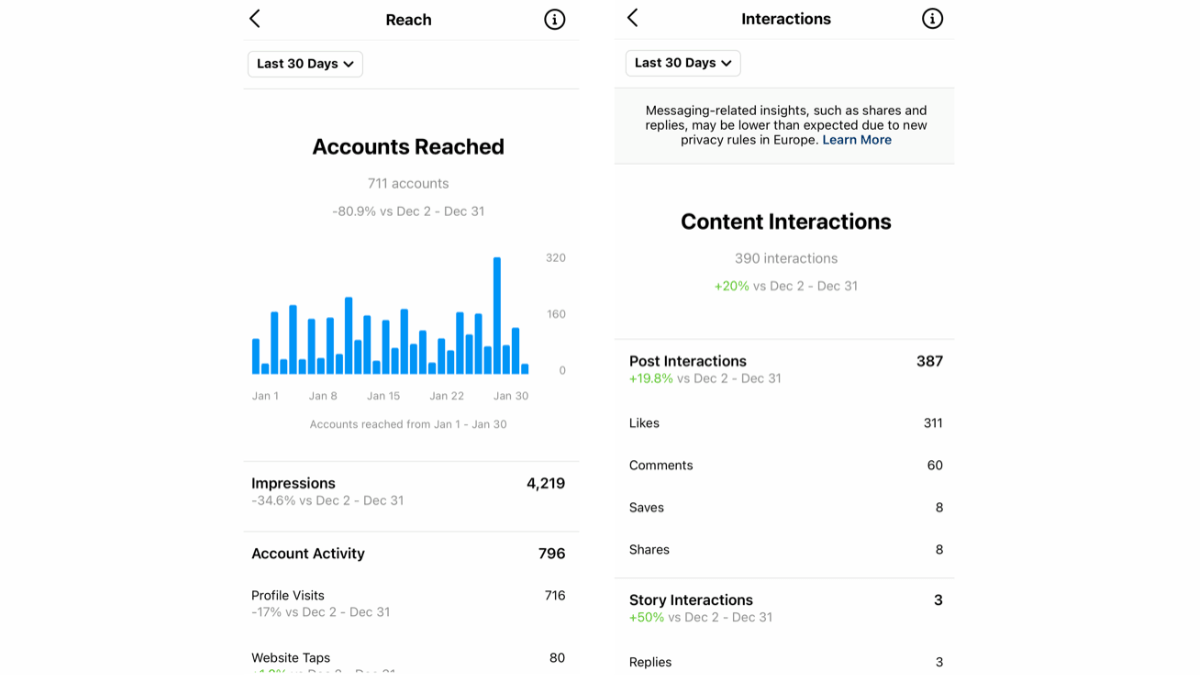
Overview Section — Your Account's Weekly Pulse
Overview provides a quick picture of account health over the selected period (7 / 14 / 30 / 90 days). Here's what you'll find:
- Accounts Reached: Unique accounts that saw any content from your account — split between followers and non-followers
- Accounts Engaged: Those who actually interacted (liked, commented, saved, sent) — always lower than Reached
- Total Followers: Overall count with growth or decline trend for the period
- Profile Views: Who visited your profile — an indicator of how effectively your content generates curiosity
💡 The correct comparison in Overview
Always compare the current period to the same period previously — not to the immediately preceding period. Comparing a regular week against a holiday week produces false conclusions. Instagram shows the percentage direction automatically — if you see a red arrow, understand the context before drawing conclusions.
Engagement Section — The Metrics That Actually Drive the Algorithm
After the April 2026 update, Engagement became a standalone tab featuring new metrics not previously available:
| Metric | What it tells you | The decision it drives |
|---|---|---|
| Sends (DM Shares) | How many times content was shared via DM — the strongest algorithmic signal | Identify your most shareable content and replicate its format |
| Share Rate (new 2026) | Sends ÷ Views — sharing rate relative to reach | Compare content of different sizes fairly |
| Saves | How many posts were saved — the "reference value" signal | Discover what your audience treats as worth returning to |
| Likes per Reach | The ratio of likes to viewers — not the absolute count | Measuring how appealing the content is to the audience it reached |
| Comments | Number of comments — conversation signal | High-comment posts generate discussion momentum worth building on |
For detailed strategies on improving each of these signals, see the engagement strategies guide.
Algorithmic weight of each action — strongest to weakest
| Action | What it signals to the algorithm | Weight |
|---|---|---|
| Sends (DM shares) | Active recommendation — "this is worth sending to someone" | ★★★★★ Highest |
| Saves | "I need this content later" — genuine value signal | ★★★★★ Very high |
| Comments | Active participation — high interest signal | ★★★★ High |
| Likes | Basic interest confirmation | ★★★ Medium |
| Profile Visits | "I want to know more about this account" | ★★★ Medium |
Audience Section — Who Follows You and Who You're Actually Reaching
The Audience section has two distinct dimensions: follower data and reached audience data. Mixing them up produces a distorted picture.
- Follower Growth: How many followers you gained and lost over the period — the trend matters more than the number
- Most Active Times: Hours and days when your followers are most active — use this to set posting times specific to your audience
- Top Locations: Most common geographic locations among your audience — useful for aligning posting timing and content direction
- Age & Gender: Demographic distribution — if it differs significantly from your target audience, review your content strategy
- Non-follower Reach: The percentage of viewers who don't follow you — the higher this is, the more your content is spreading beyond your existing audience
⚠ The 90-day limit — what to export before it's gone
Native Insights retains data for only 90 days. If you want to compare performance across quarters, you need to export your data regularly. Export from: your profile → Insights → export option — or use a third-party tool that retains a longer history. For tool comparisons, see the advanced analytics tools guide.
Reach Sources — Where Your Audience Actually Comes From
For every post, Insights shows a breakdown of which surfaces drove reach. Knowing the dominant source tells you what to focus on:
- Home (Feed): Followers who saw it in their main feed — reflects the strength of your relationship with your existing audience
- Explore: Non-followers who discovered the content — a strong signal of effective algorithmic distribution
- Hashtags: Reach driven by hashtag search — evaluates the effectiveness of your specific hashtags
- Profile: Profile visitors who saw the post directly from your grid
- Other: DM shares, external website embeds, and miscellaneous sources
If most of your reach comes from Home, your content satisfies your existing audience but isn't spreading outward. High Explore reach means the algorithm is actively distributing the content to new audiences. This pattern connects directly to your Instagram SEO strategy.
Reels Insights — New Metrics That Diagnose What You Can't Otherwise See
Reels have exclusive metrics not available for regular posts — and the most important are those added in 2025 and 2026:
💡 Two important notes about Reels Insights
- Your own views don't count: Instagram excludes your own views of your content from all metrics — the numbers reflect real audience behavior only.
- Post-watch behavior: Reels Insights shows what a viewer did after watching: visited profile / followed / engaged further / scrolled past. This is the sharpest indicator of whether a Reel converts a stranger into a follower.
| Metric | What it means | How to improve it |
|---|---|---|
| Views | Total play count including replays | Loop content naturally raises Views without additional reach |
| Reach | Number of unique people who watched it | Strong hook in first 3 seconds expands distribution |
| Total Watch Time | Total time all viewers spent watching | Connected to Reel length × number of plays |
| Average Watch Time | Mean time per viewer — the most accurate retention measure | Fast pacing + no filler content raises the average |
| Retention Rate (new 2025) | Graph showing by second where viewers drop off | Sharp drop at second 3 = weak hook / mid-Reel = filler |
| Skip Rate (new 2026) | Percentage who swiped away before completing | High Skip Rate in first 2 seconds = opening frame not compelling |
| Non-follower Reach | Percentage of viewers who don't follow you | If low — the Reel isn't leaving your follower circle |
| Profile Visits from Reel | How many viewers went to your profile after watching | CTA "follow me for [specific value]" at the end raises this |
How to read Retention Rate — the graph that tells the real story
Retention Rate shows the percentage of viewers remaining at each second of the Reel. Drop-off patterns tell you the specific problem:
- Sharp drop in first 2–3 seconds: The hook isn't stopping the scroll — the opening frame doesn't generate enough curiosity
- Gradual continuous decline: Normal — but if it's faster than your other Reels, the content is losing momentum too quickly
- Sharp drop in the middle: An inflection point — content that slows down, repeats, or fails to deliver the expected value
- Rise at the end: Loop signal — viewers replaying, an excellent algorithmic signal
Stories Insights — Metrics That Differ Entirely from Reels
Stories don't distribute to non-followers — their metrics reflect the depth of your relationship with existing followers, not new audience reach.
| Metric | What it tells you | Good benchmark |
|---|---|---|
| Story Views | How many followers opened the Story | Declines the later you appear in the Story tray |
| Completion Rate | Percentage who watched the Story all the way through | High = content maintains attention throughout |
| Taps Forward | Who tapped to the next Story without finishing | High = Story is boring or too long |
| Taps Back | Who went back to re-see your Story — a positive signal | High = content worth re-reading |
| Exits | Who left Stories entirely after your Story | High = your Story sharply diminishes interest |
| Replies | DM replies to your Story — strongest relationship signal | Each reply strengthens your position in the Story tray |
| Sticker Interactions | Responses to polls, questions, and emoji sliders | Higher interaction = higher probability of appearing first in tray |
| Link Clicks | Who tapped a link in the Story — direct conversion indicator | Measures how effectively Stories drive traffic to a page or link |
Carousel Insights — Why Carousels Can't Be Evaluated Like Regular Posts
Carousels receive an automatic second distribution window — Instagram re-serves them to people who didn't engage the first time, starting from a different slide. This means Views for a carousel may reflect two distribution waves, not one.
- Carousel Swipe Rate: What percentage swiped between slides — indicates how well the first slide motivates continued browsing
- Saves: The most important metric for carousels — reveals whether the content is reference-worthy enough to return to
- Reach from second wave: If you see a Reach increase 24–48 hours after posting — the automatic second distribution window is working
Weekly and Monthly Insights Review Routine
Weekly review — 10 minutes every week
4 metrics to read weekly (no more)
- Non-follower Reach for your top Reel: Is your Reels content escaping your follower circle?
- Sends (DM Shares) for the week: Which post was shared most? That content deserves replication
- Saves for the week: Which content was saved? Tells you what your audience treats as reference material
- Follower Growth: Is growth continuing, flat, or negative? The direction matters more than the number
Monthly review — 3 strategic questions
- What are the three posts with the highest Sends this month? — What did they have in common? Topic / format / hook / length?
- Is Non-follower Reach growing compared to last month? — If not, Reels aren't spreading outside your follower circle at the required rate
- Is Average Watch Time improving in the last 4 Reels compared to the 4 before? — An upward trend confirms improving hook and pacing quality
Diagnosing Problems Through Insights — Three Patterns and Their Solutions
🔴 Pattern 1: Low Reach
Symptoms: Weak Non-follower Reach — low Views generally
Diagnosis: Open Reels Insights — if Skip Rate is high in the first 3 seconds = hook problem. If Retention Rate collapses in the middle = content problem, not a hook problem
Solution: Test different hooks via Trial Reels before publishing to your full audience
🔴 Pattern 2: Good Reach but Weak Engagement
Symptoms: Acceptable Reach — but Sends and Saves are low
Diagnosis: Content is being watched but not generating desire to share or save
Solution: Review your CTA — did you explicitly ask for a share or save? Review the value — does the content offer something worth saving or sending?
🔴 Pattern 3: Good Reach and Engagement but Followers Not Growing
Symptoms: Profile Visits are high — but Follows are weak
Diagnosis: Visitors are reaching your profile but not finding a reason to follow
Solution: The problem is in the profile (Bio) or the grid — is it immediately clear what you offer? See the profile optimization guide
Native Insights Limitations — When You Need a Third-Party Tool
Instagram Insights answers "what happened" — it doesn't answer "why" or "what are your competitors doing":
- 90-day limit: No longer history for year-over-year comparison
- No competitor comparison: You can't see other accounts' performance data
- No automatic export: You must manually export data before the 90-day window closes
- Limited caption and hashtag analysis: No way to see which specific hashtag drove the most reach
If you need longer history, competitor tracking, or structured reports, see the advanced analytics tools guide for a comparison of third-party options.
Frequently Asked Questions About Instagram Insights
What's the difference between Reach, Impressions, and Views?
Reach is the number of unique accounts that saw the content. Views (which replaced Impressions as of April 2025) is the total number of times content was viewed, including replays from the same person. Example: a Reel watched by 800 people, with 100 of them watching it twice = Reach 800 but Views 900. Impressions was fully retired for new content after April 2025.
Why did my views suddenly drop even though I'm posting consistently?
Open Reels Insights and look: if Skip Rate is high in the first 2 seconds — the hook isn't stopping the scroll. If Retention Rate collapses mid-Reel — the content loses momentum. If only Non-follower Reach dropped while follower Reach is stable — the Reels aren't spreading outside your follower circle. Don't change everything at once — identify the specific problem first, then test one solution at a time.
Can my followers see my Insights data?
No — Insights is private and visible only to the account owner. What followers see is the public like count and comment count, just like any regular user would. Even if your account is public, the analytics data is not visible to anyone except you.
Can I access Insights from a desktop computer?
Yes — go to instagram.com, open your profile, and click "Insights" or the graph icon. The web version provides larger charts and clearer data export options than the mobile app. Meta Business Suite on desktop offers additional metric filtering options beyond what the native app provides.
Is Insights available for personal accounts?
No — Instagram Insights is exclusive to Professional accounts (Creator or Business). Personal accounts have no access to any analytics. Converting to a Creator or Business account is free and does not affect your organic reach, as Mosseri has confirmed explicitly.